
The ChatGPT Moment of Robotics Has Arrived
Spatial replay tells you what a robot did. Here is how to build the operational context to know why it did it.

Jensen Huang just announced the “ChatGPT moment” for robotics. But nobody is talking about what happens to the telemetry after the demo.
Yesterday, Jensen Huang walked onto the stage at the SAP Center and declared that the ChatGPT moment for autonomous physical AI has arrived.
There were 110 robots on the show floor. Humanoids, robo-taxis, autonomous factory arms. The hardware story for Physical AI is no longer a theoretical question—it is a shipping product roadmap.
But the slide that stopped me wasn’t the Vera Rubin architecture announcement. It was quieter than that. Huang put up what he called his most important slide of the keynote: “Structured data is the foundation of trustworthy AI.” And then: “Unstructured data is the context of AI.”
He was talking about enterprise software agents. I kept thinking about fleets of robots.
What Physical AI Actually Generates
A ROS2 robot: the software standard that runs on everything from a student’s TurtleBot3 to Boston Dynamics’ Spot publishes a continuous, relentless stream of structured telemetry. Every movement, every sensor reading, every velocity command.
Here is what raw odometry from a simulated TurtleBot3 looks like at rest:
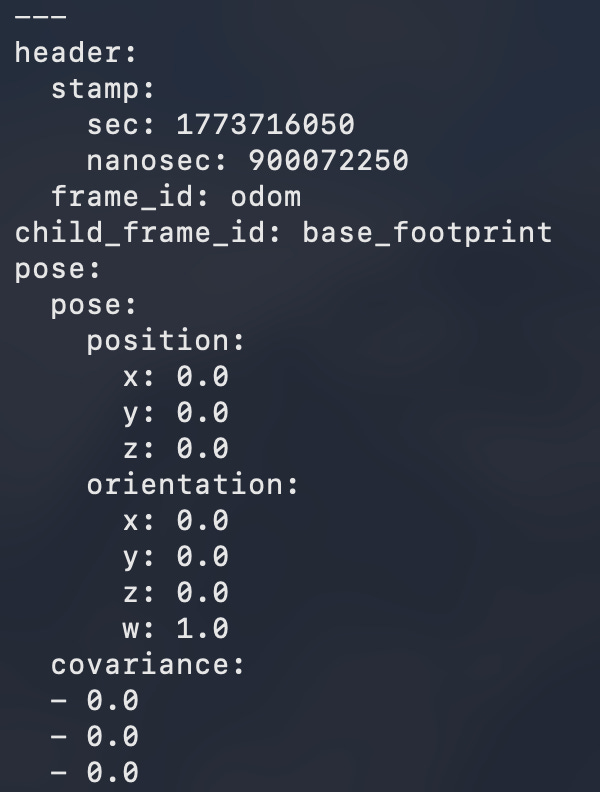
ROS2 topic echo /odom — stationary robot, all zeros
And here is that same robot the moment you publish a velocity command (linear 0.2, angular 0.5), sending it into a circle:
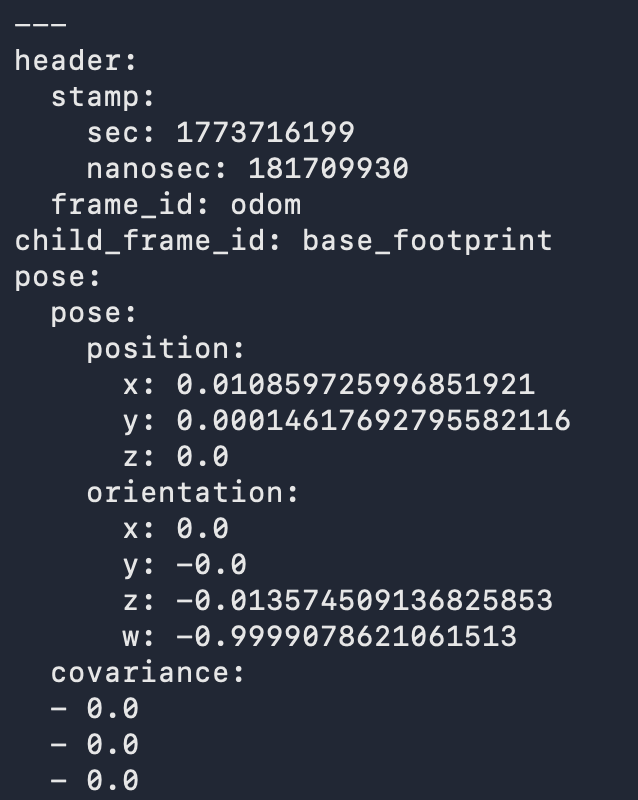
ROS2 topic echo /odom — moving robot, x/y/orientation updating
The position updates 10 times per second. The orientation quaternion spins. This is kinematic state, continuously broadcast. Now realize that a real deployment robot generates this, plus LiDAR point clouds, camera feeds, IMU data, battery states, and nav stack outputs all, simultaneously.
The King of the Replay Buffer: Foxglove
If you want to visualize this firehose of data, Foxglove Studio is the best tool in the physical AI ecosystem.
It is genuinely excellent. You connect it to a live robot or a recorded MCAP file, and you get a beautiful, real-time visualization of every single topic. Here is what that looks like when connected to my TurtleBot3 sim, tracking position x plotted over time as the robot drives in a circle:
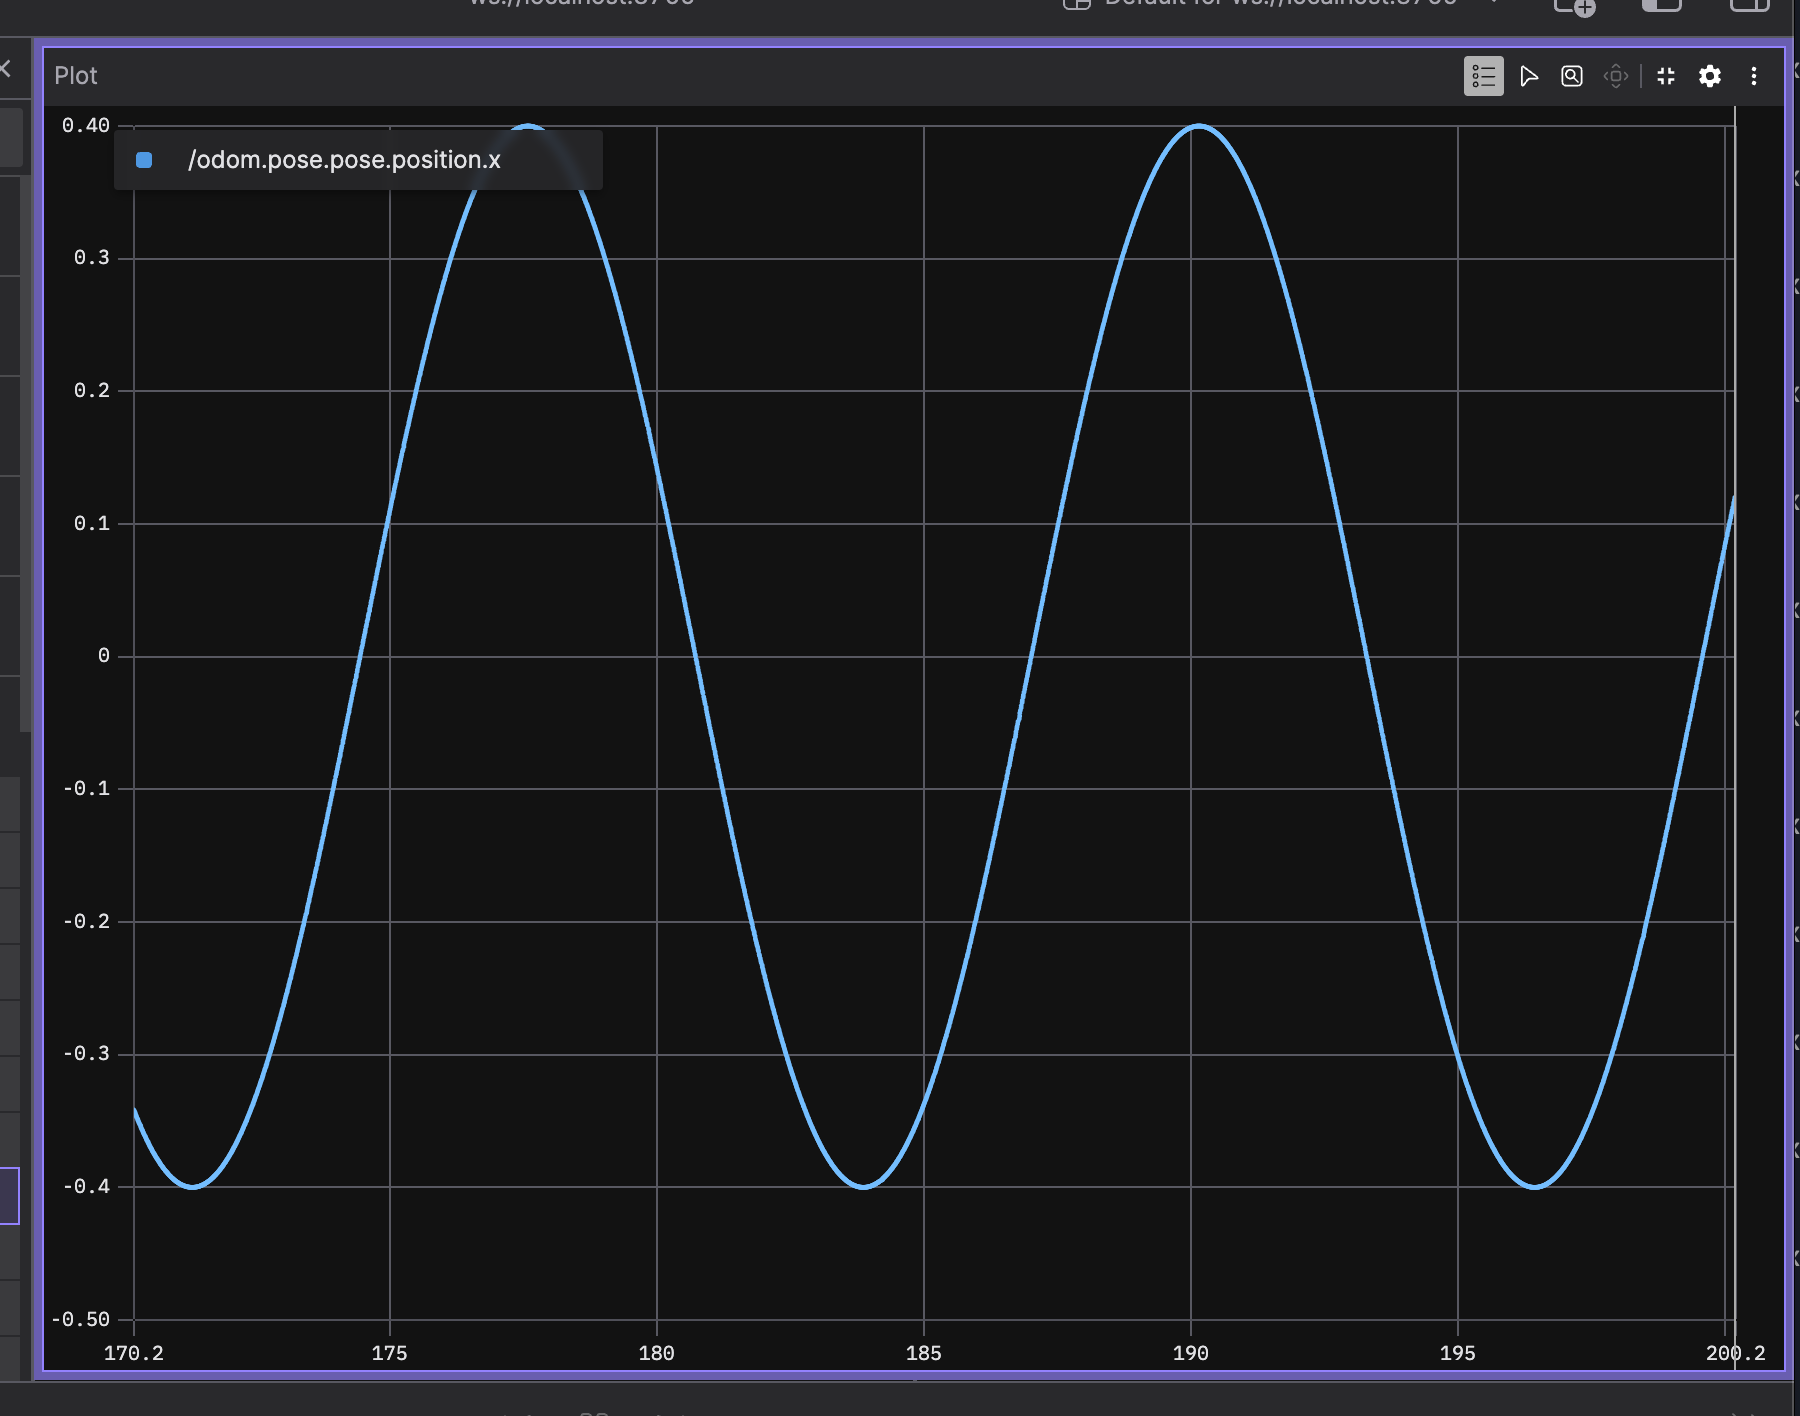
Foxglove Studio sine wave plot - /odom.pose.pose.position.x
That sinusoidal curve is the robot’s x-coordinate oscillating as it traces its path. Meanwhile, the 3D panel shows the robot’s coordinate frame updating in real-time against the world:
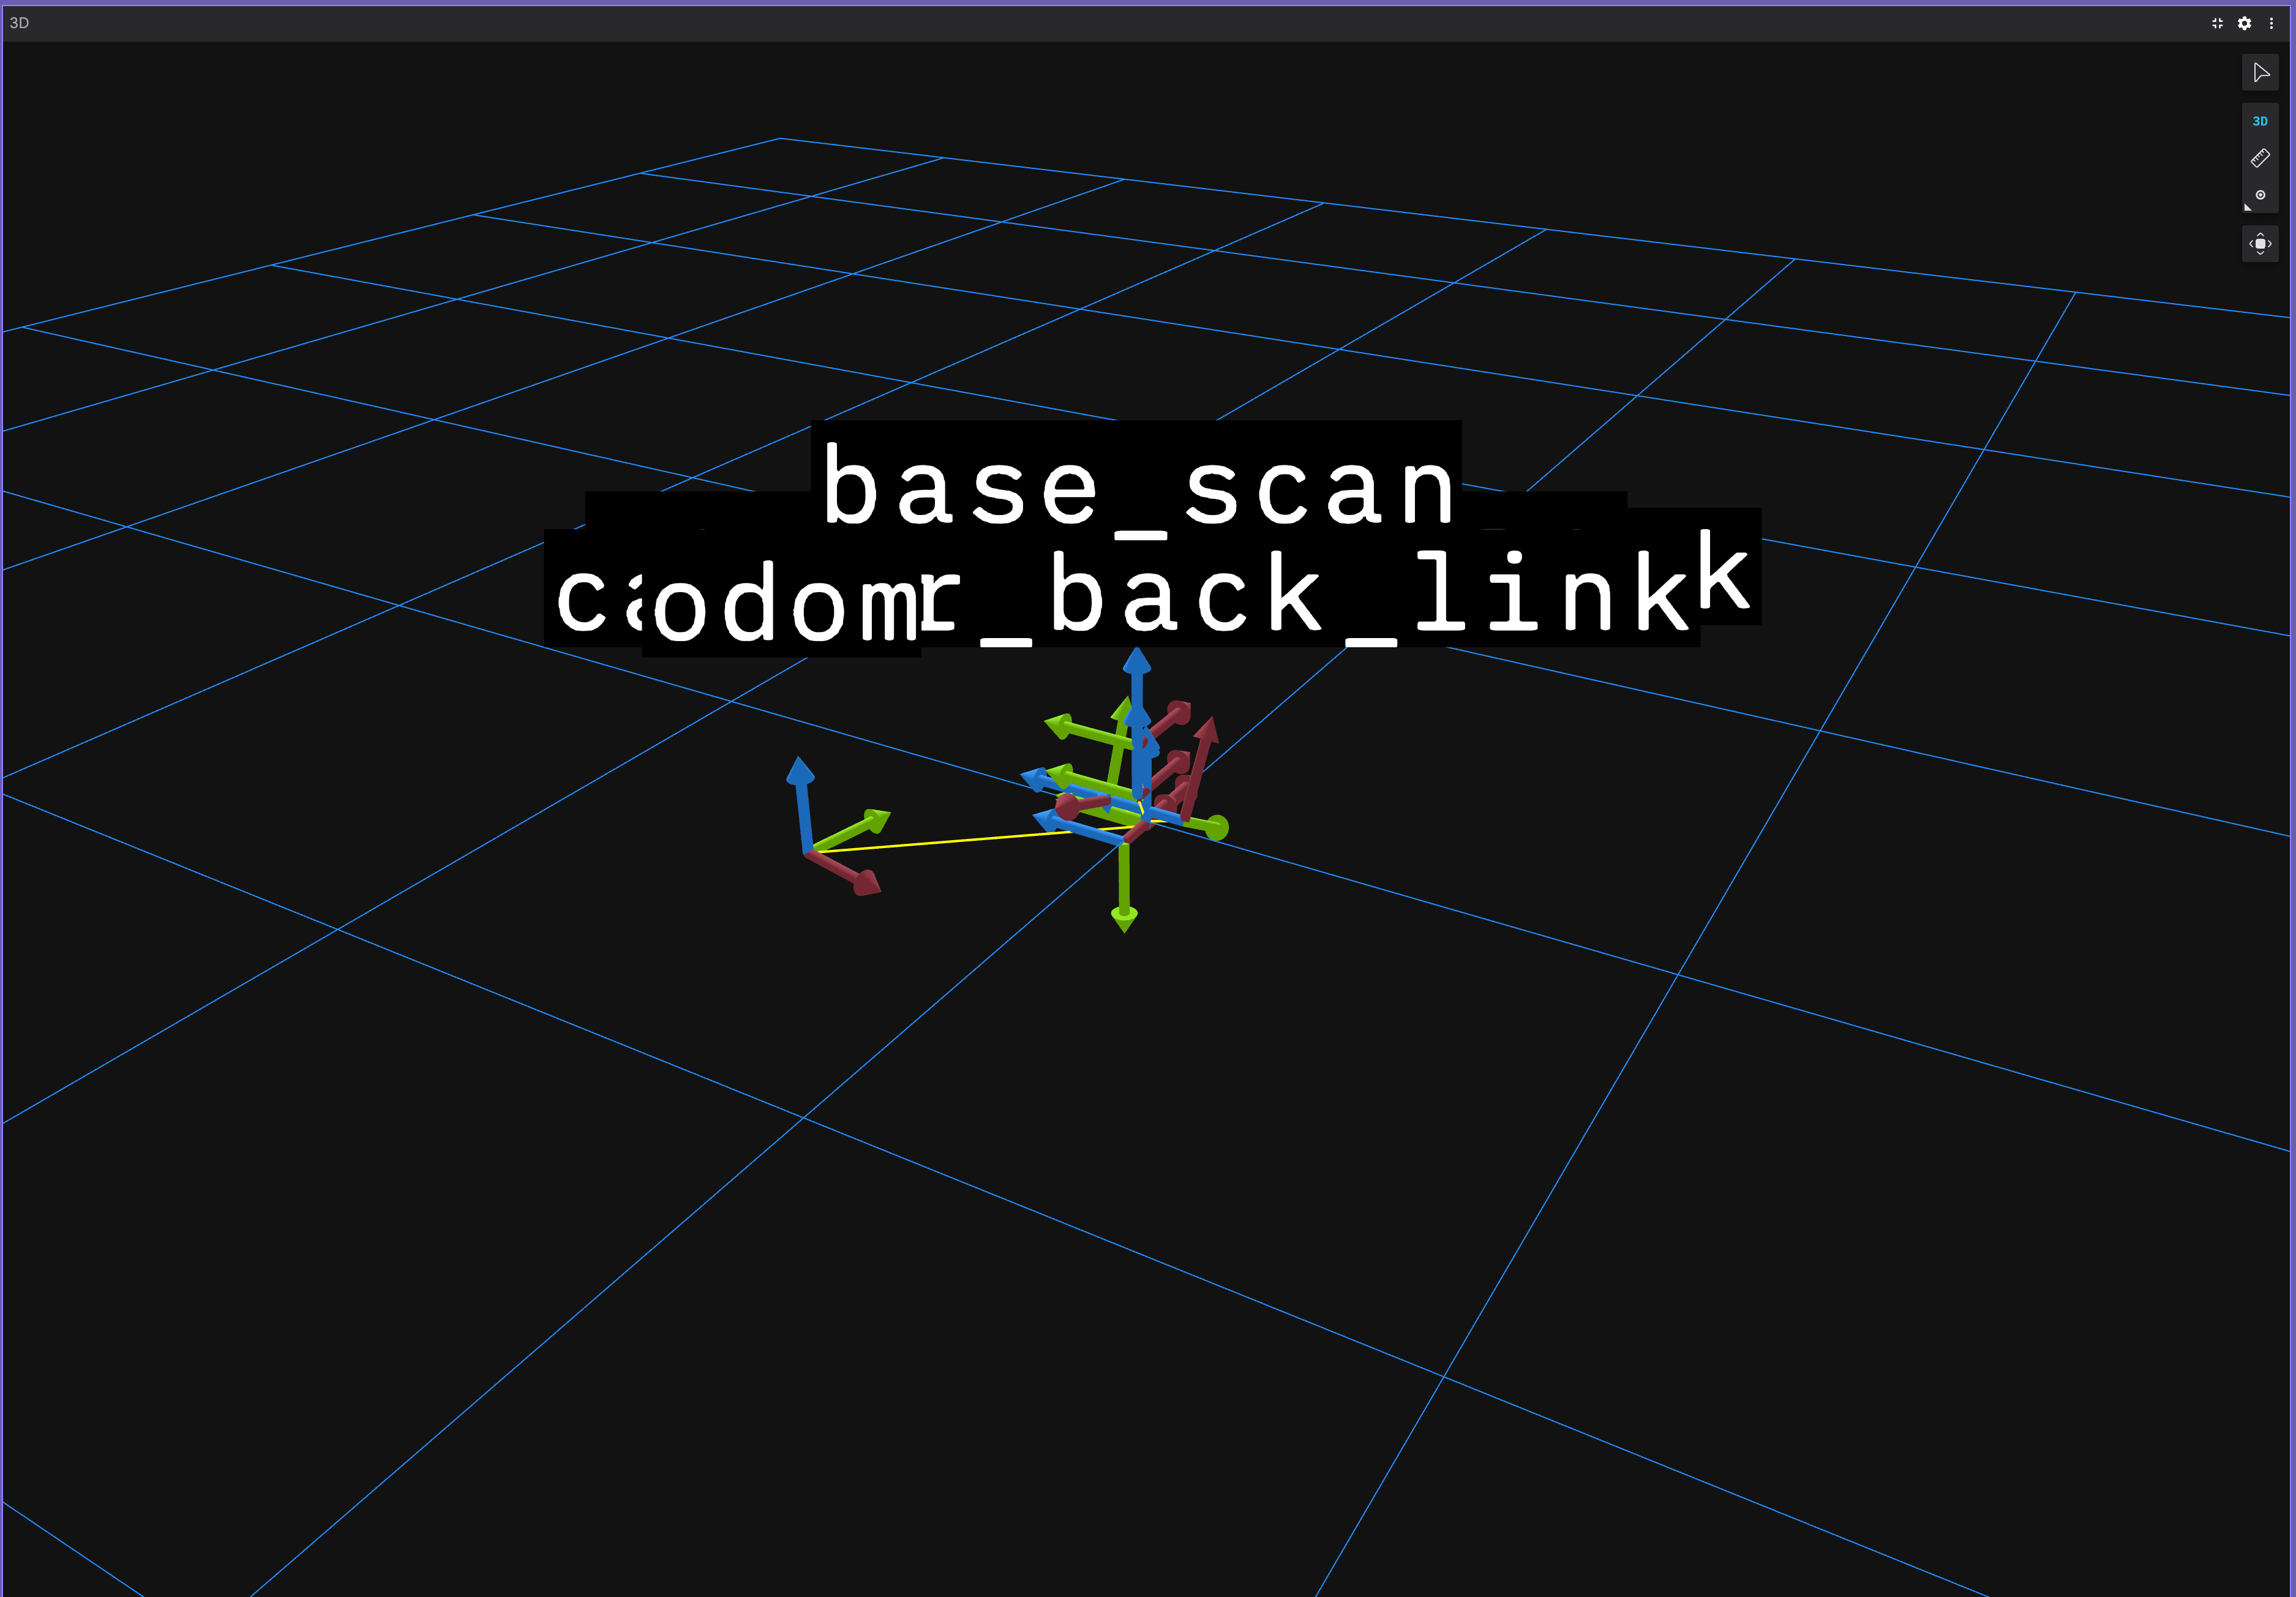
Foxglove Studio 3D panel - robot frame in sim
If you need to inspect a system or replay an event, Foxglove is the undisputed answer. It handles the spatial and temporal reality of the robot perfectly.
It answers the critical question: What did the robot do?
The Question Nobody is Answering
But Foxglove and the visualization ecosystem at large are essentially a world-class replay buffer.
It does not answer: Why did the robot stop unexpectedly at 14:32:07? What was it doing in the 30 seconds before that stop? Has it stopped in this specific map region before? Does this failure pattern correlate with a particular task type or a degrading battery level?
These are operational questions, and answering them requires more than just a sensor stream. It requires context. It requires understanding the relationship between discrete events, the history of a robot’s behavior in a specific environment, and the anomaly patterns across 50 deployments, not just one recording.
This is the operational context problem. And right now, nobody has built the data infrastructure layer to solve it.
Building the Physical Context Fabric
I am open-sourcing a project to build that exact layer. I call it the Physical Context Fabric.
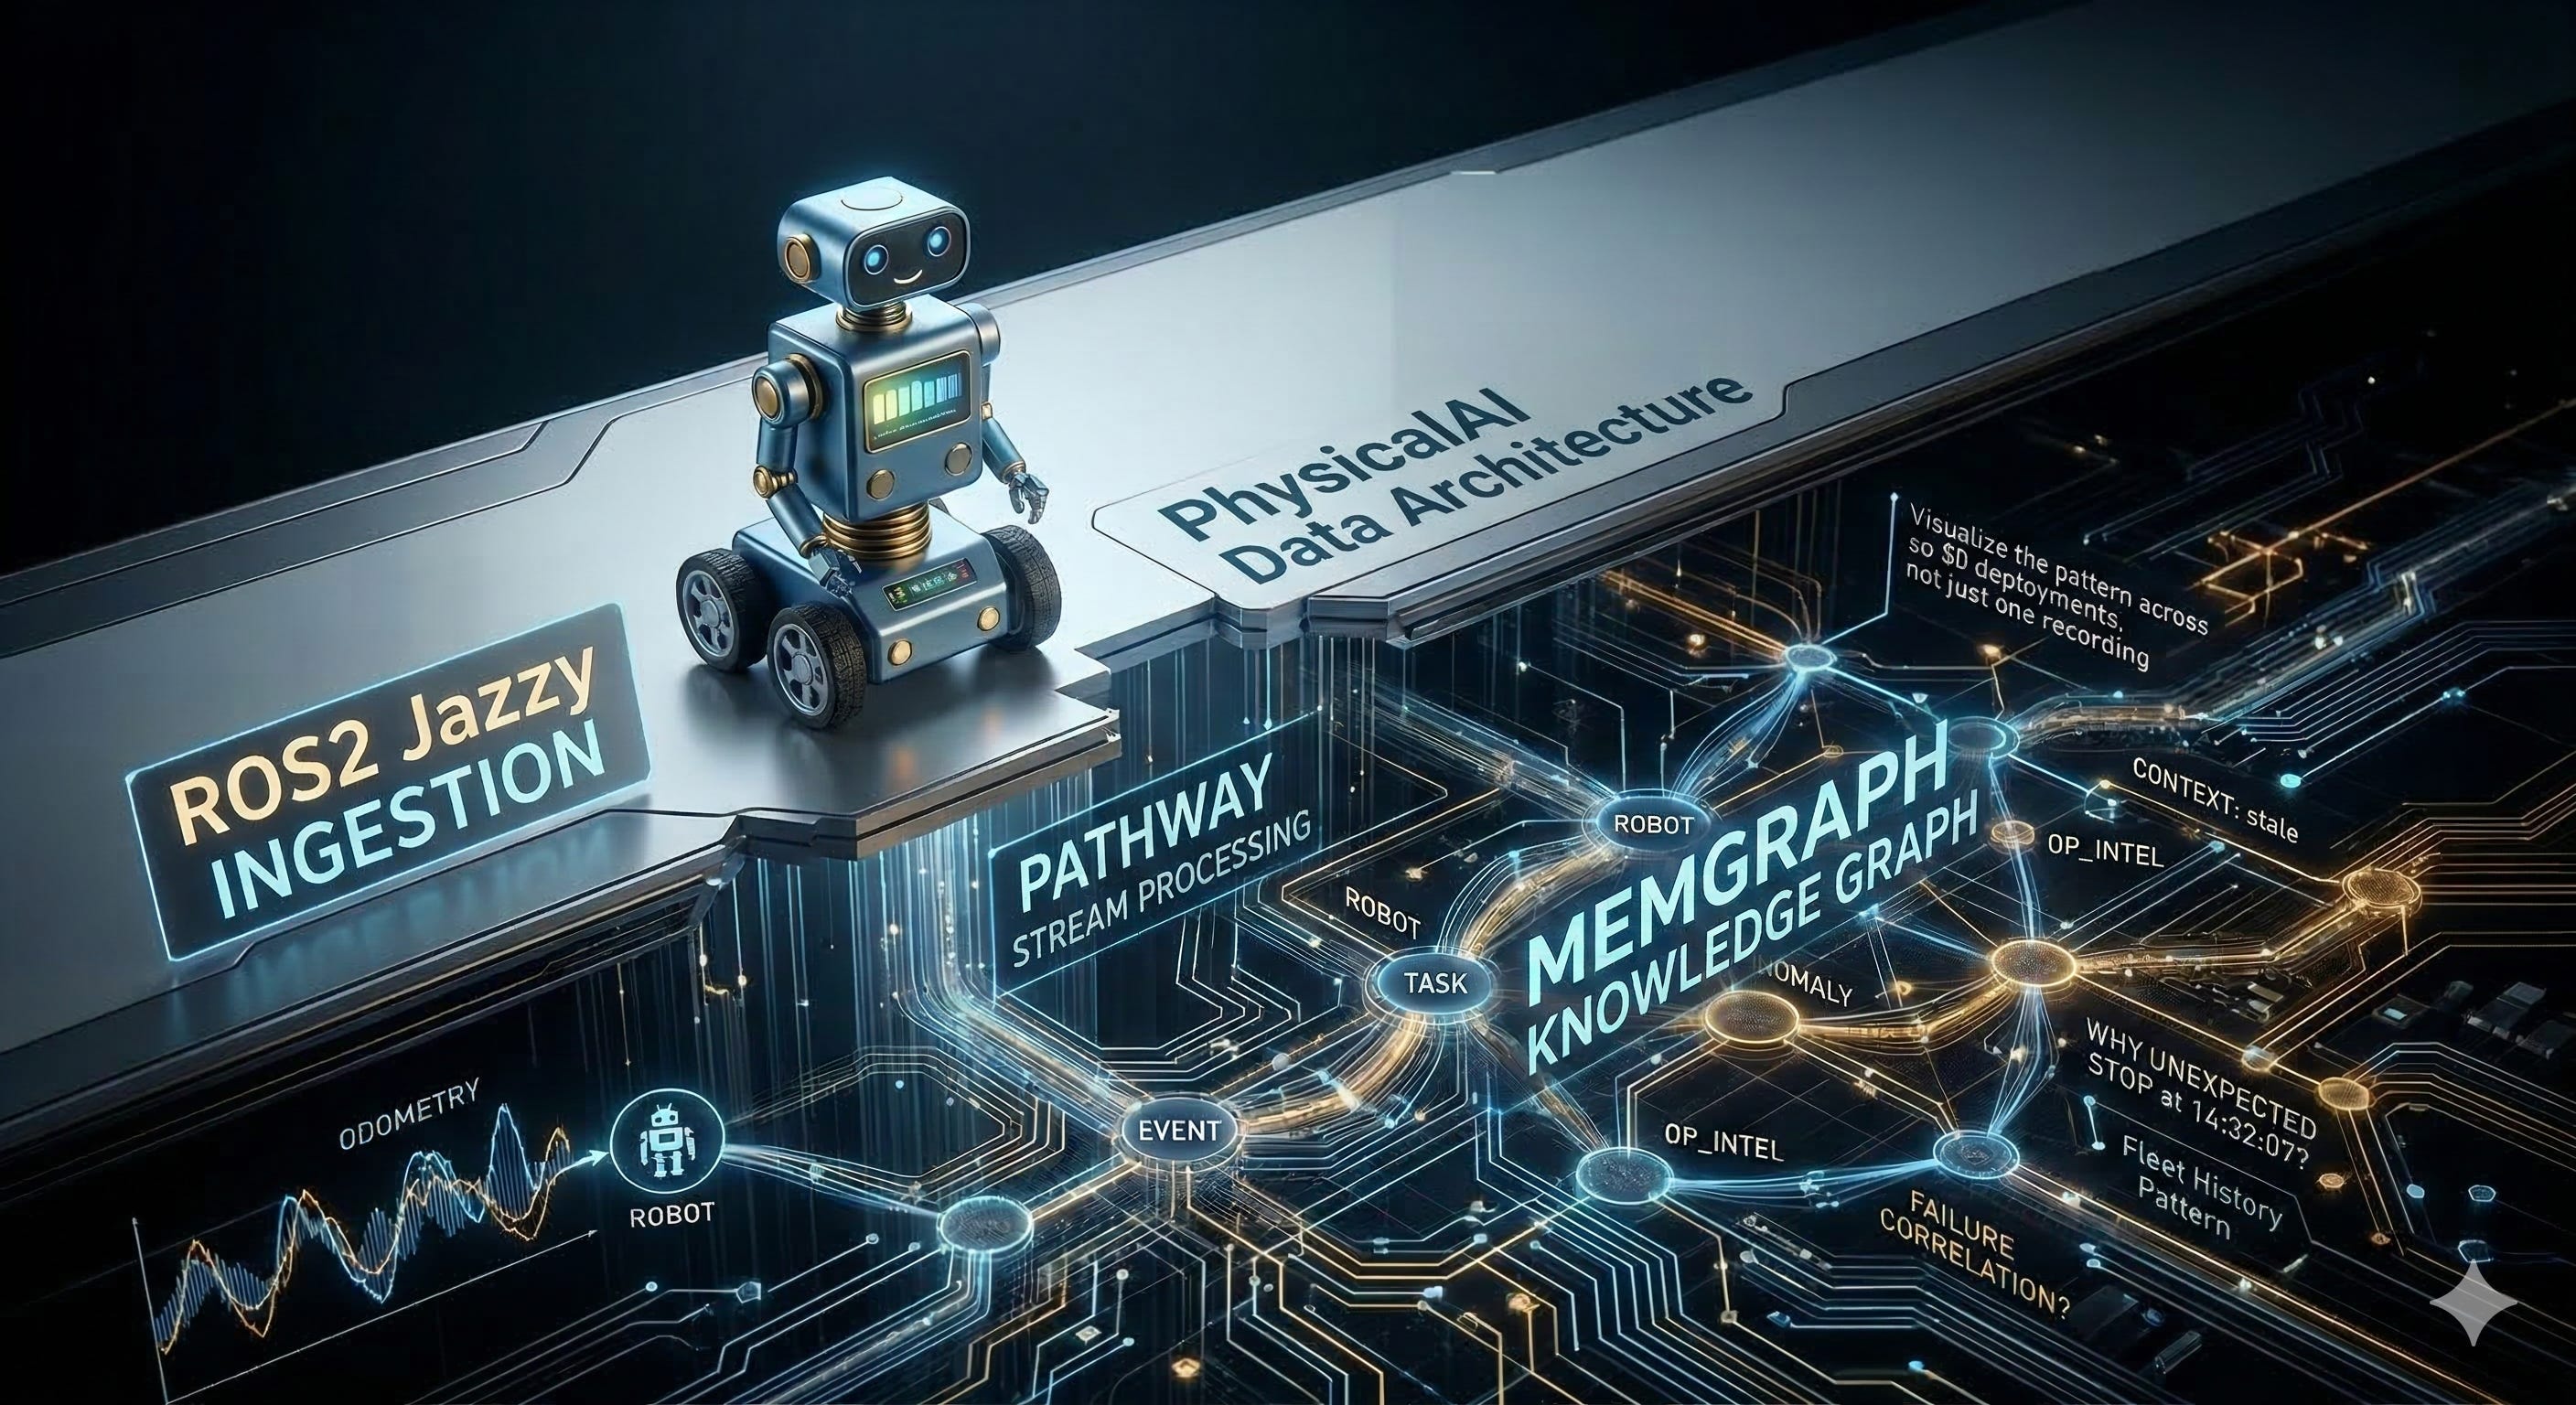
The architecture is a real-time streaming pipeline sitting directly above ROS2, feeding into a live knowledge graph.
The Pipeline: ROS2 topics → Pathway (Stream Processor) → Memgraph (Knowledge Graph)
The schema is designed to connect the relational dots that raw telemetry leaves behind: Robot → Task → Event → Anomaly → Environment_State
The Pathway layer watches the telemetry stream in real-time and detects anomalies. For example: a velocity drop below a specific threshold, held for N seconds, becomes an unexpected_stop event. That event is enriched with its full context window and written directly to Memgraph.
Suddenly, the queries that become possible aren’t just plotting lines on a graph. They look like this:
“What specific events preceded the last 5 unexpected stops across the fleet?”
“Which map region has the highest historical anomaly rate?”
“How long do tasks of type X typically take before a hardware failure occurs?”
Here is the first version of the context bridge in action, a Python node that reads /odom and /cmd_vel and emits structured JSON events in real-time:
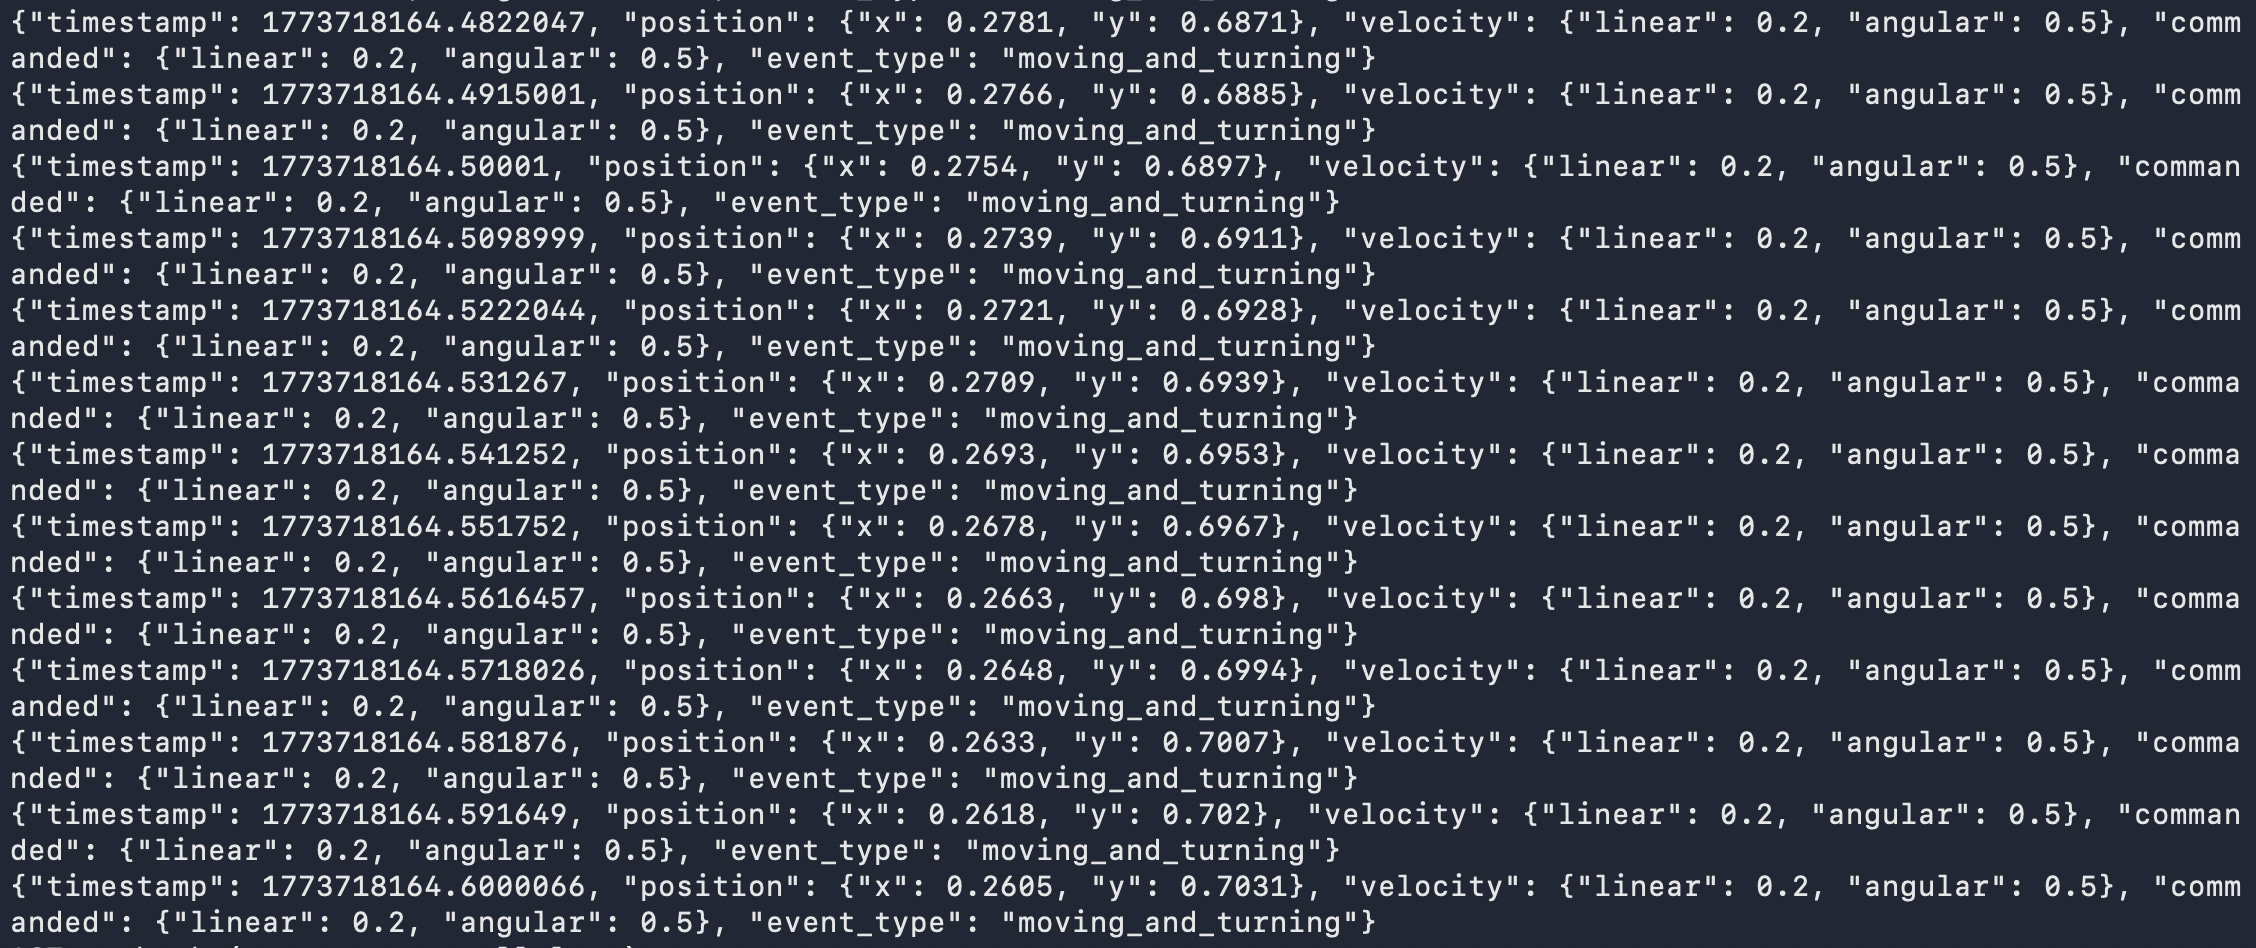
odom_subscriber.py JSON output streaming - timestamp, position, velocity, event_type: moving_and_turning
Each event carries a timestamp, position, velocity, commanded velocity, and an inferred event type. This is the raw material the knowledge graph ingests. This is what turns a sensor replay into operational context.
Why This Matters Right Now
Jensen Huang said it plainly on that stage: structured data is the ground truth of the AI era.
The Physical AI world is about to experience a massive scale-up. We are going to see a lot more robots, a lot more deployments, and a lot more fleet operators asking why their robots behaved the way they did.
The hardware roadmap is clear. The visualization tooling (thanks to teams like Foxglove) is elite. The glaring gap is the data infrastructure layer between raw telemetry and operational understanding.
That gap is what the Physical Context Fabric is built to fill.
The repository is live here: github.com/snudurupati/physical-context-fabric
This is Post 1 of a series documenting the build in public. The full stack, including the Pathway anomaly detection engine and the Memgraph knowledge graph integration, is coming in the posts ahead.
If you are building in physical AI infrastructure or dealing with fleet-scale telemetry, I’d love to hear from you.
Sreeram Nudurupati | LinkedIn Sreeram writes about context engineering and AI data infrastructure at nudurupati.co. He is also building TexonAI: context engineering for enterprise B2B.