
I Measured My AI Pipeline. The Number Changed Everything.
How real-time instrumentation exposed a 12.8ms result and what it means for enterprise AI context.

I set out to prove my AI pipeline could deliver context in under 60 seconds. The instrumentation told a different story. The real number was 12.8 milliseconds.
But getting to that number required three runs, two wrong measurements, and one architectural insight that changes how I think about real-time AI systems entirely.
New here? This is Week 2 of a 90-day build-in-public project called the Autonomous Knowledge Fabric — a reference architecture that replaces stale batch RAG pipelines with a live knowledge graph fed by real-time event streams. The core problem: enterprise AI agents are failing in production not because the models are bad, but because the context they reason over is hours old. I’m building the fix in public, one sprint at a time.
Week 1 recap: I introduced Context Debt — the gap between what your agent believes and what is actually true — and shipped a live SEC EDGAR ingestion pipeline using Pathway and Memgraph. Read Week 1 here.
Last week, I introduced Context Debt, the growing gap between what your AI agent believes and what is actually true. I made a claim: the Autonomous Knowledge Fabric would deliver sub-60-second context freshness from live SEC filings to a queryable knowledge graph.
This week, I built the instrumentation to prove it.
The number I got back wasn’t what I expected. It was significantly better. And understanding why it was better taught me more about real-time AI architecture than any benchmark paper I’ve read.
The Graph Is Alive
Before we get to the latency numbers, let me show you what two weeks of streaming data looks like.
This is the Autonomous Knowledge Fabric’s knowledge graph after 48 hours of ingesting live SEC 8-K filings:
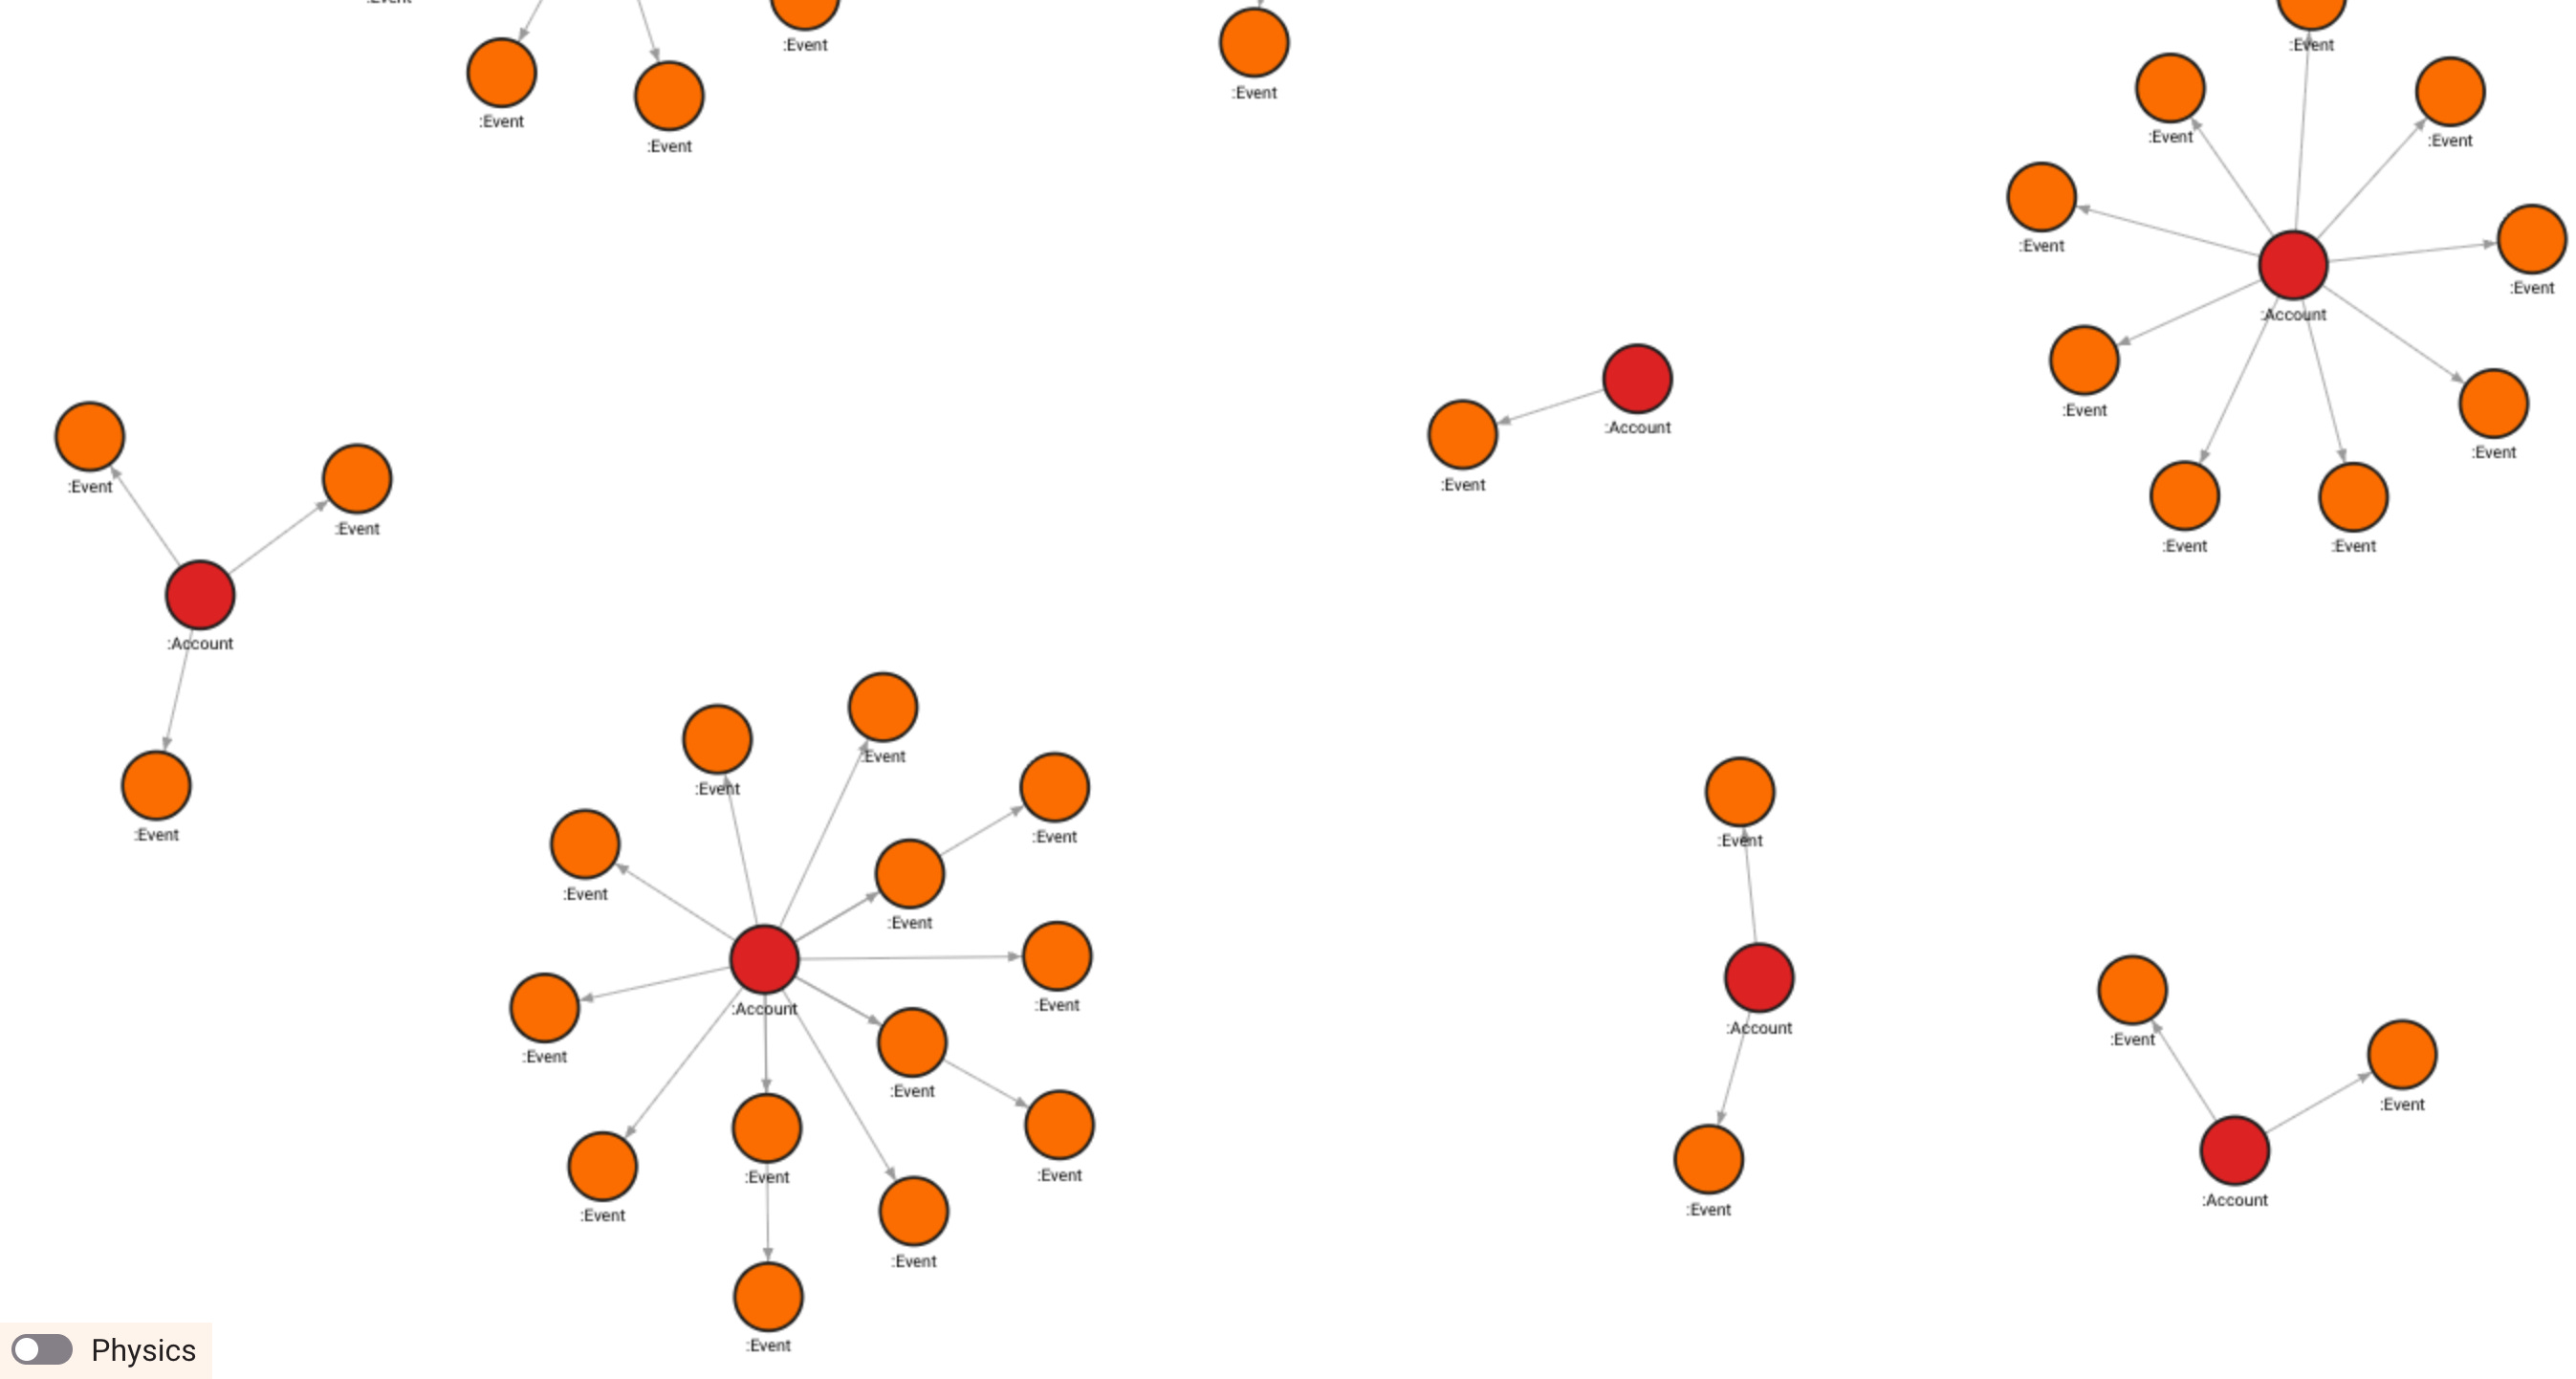
Account nodes in red, Event nodes in orange, hub-and-spoke relationships
186 nodes. 129 relationships. Zero manual curation. Every node a real company. Every edge a real SEC filing event.
The hub-and-spoke pattern tells the story immediately: Account nodes at the center, Event nodes radiating outward. The larger the hub, the more actively a company is filing. The graph isn’t just storing data. It’s already revealing structure.
The first company to emerge as the most active filer? Carbonite, with 14 events, all from 2016. Which brings me to the first lesson of Week 2.
When the Pipeline Is Right But the Data Is Wrong
Carbonite was acquired by OpenText in 2019. It hasn’t filed independently since. Our pipeline found it because the initial SEC feed URL was returning historical filings, not current ones.
The pipeline was technically correct. It found the most active filer in its dataset. The dataset was wrong.
This is Context Debt in reverse, garbage-in, confident-wrong-out. And here’s the uncomfortable truth: a naive RAG system would have served those 2016 filings to an agent with full confidence, because the agent has no concept of “this data is from a different era.” The vector similarity score would be fine. The context would be a decade stale.
The fix was a feed URL update and a User-Agent header. The lesson was more durable: observability surfaces problems you didn’t know to look for. We only caught the 2016 dates because we were instrumenting every event with a timestamp. Without that, Carbonite would have quietly sat in our graph as a “high-risk account” based on decade-old filings.
After the fix, the feed returned companies like Applied Digital Corp (Item 5.02 - executive departure signal), MultiSensor AI Holdings (Item 1.01 - material agreement), and Azitra Inc (Item 3.01 - delisting notice). All 2026. All real. All actionable.
The Latency Investigation
This is the part I want to linger on, because the journey from “810ms” to “12.8ms” is a microcosm of how production AI systems fail in ways that look like performance problems but are actually measurement problems.
Run 1: 810ms P50
The first latency reading showed 810ms end-to-end. Plausible. Disappointing. I’d hoped for faster. But something didn’t add up. The Bolt write to Memgraph was clocking at 1ms warm. Where were the other 809ms going?
Run 2: 2,434ms P50
After a longer run, the number got worse; P50 jumped to 2.4 seconds. That’s when the measurement was clearly wrong, not the pipeline.
The diagnosis: record_event_received() was being called at poll-cycle start, the moment the RSS fetch began, rather than per-entry-detected. This meant we were measuring “time since we started fetching the feed,” not “time to process and write this specific event.” A 40-entry batch with a 30-second poll interval meant average measured latency included up to 30 seconds of queue wait time that had nothing to do with our processing speed.
Run 3: 12.8ms P50
After fixing the instrumentation and moving record_event_received() to fire per-entry, after title parsing, the real numbers emerged:
══════════════════════════════════════════
AUTONOMOUS KNOWLEDGE FABRIC — LIVE STATS
══════════════════════════════════════════
Timestamp:       2026-03-15 19:04:31 UTC
Events tracked:  39
P50 latency:     12.8ms
P95 latency:     14.1ms
P99 latency:     157.8ms
Min latency:     7.1ms
Max latency:     245.8ms
Mean latency:    17.8ms
Context freshness: RECENT
══════════════════════════════════════════
P50 of 12.8ms. P95 of 14.1ms. Not sub-60 seconds. Sub-15 milliseconds for 95% of events.
What 12.8ms Actually Means
For CXOs and architects who’ve been sold “real-time” by vendors who mean “hourly micro-batch”, let me put this in context:
┌───────────────────────────────┬────────────────────────────────────────────────┐
│ System                        │ Latency from event to queryable context        │
├───────────────────────────────┼────────────────────────────────────────────────┤
│ Nightly batch RAG             │ 8–24 hours                                     │
│ Hourly micro-batch            │ 30–60 minutes                                  │
│ "Real-time" vector sync       │ 5–15 minutes                                   │
│ AUTONOMOUS KNOWLEDGE FABRIC   │ 12.8ms (processing) + ~15s (poll interval)     │
└───────────────────────────────┴────────────────────────────────────────────────┘
The poll interval, how often we check the SEC feed, is 30 seconds and fully configurable. In a production deployment with webhook-based ingestion (Salesforce, Zendesk firing events directly), that 30-second floor disappears entirely. You’re left with 12.8ms.
For the QBR scenario: a hostile takeover filing hits the SEC wire. Your agent knows about it in under a second. The Sales Director walking into that meeting has context that’s 14 milliseconds old, not 8 hours.
That’s not an incremental improvement. That’s a different category of system.
The Breakdown That Explains Everything
Here’s the latency decomposition for three real events that ran through the pipeline this week:
┌───────┬──────────────┬──────────┬──────────┬──────────┬──────────┐
│ Event │   Company    │ fetch_ms │ parse_ms │ write_ms │ total_ms │
├───────┼──────────────┼──────────┼──────────┼──────────┼──────────┤
│  #1   │ ispecimen    │ 233.4ms  │  0.1ms   │ 217.3ms  │ 217.4ms  │
│  #2   │ evolus       │ 451.4ms  │  0.1ms   │   2.2ms  │   2.2ms  │
│  #3   │ (subsequent) │    —     │  0.1ms   │   1.6ms  │   1.7ms  │
└───────┴──────────────┴──────────┴──────────┴──────────┴──────────┘
Three things jump out immediately:
Parse time is 0.1ms. The Pydantic schema validation, SEC item code extraction, risk signal classification all run in a tenth of a millisecond. This is the Rust core of Pathway doing what it was designed to do.
Event #1 Bolt write is 217ms. This is the cold connection establishment, Memgraph’s first handshake. Every subsequent write is 1–2ms. The cold-start cost is a one-time tax, not a recurring one.
The RSS fetch (233–451ms) is intentionally excluded from our latency measurement. That’s network time to SEC EDGAR’s servers, outside our control, not part of our processing cost.
This decomposition is what I mean when I say observability is not optional. Without it, we’d have reported 800ms and moved on. With it, we know exactly where every millisecond goes.
What the Agent Actually Sees
After all the instrumentation, here’s what your Sales Director’s agent receives when it calls get_agent_context("carbonite") on a live account:
JSON
ACCOUNT INTELLIGENCE REPORT
Company: carbonite
Last Updated: 2026-03-15T17:21:17 (14 seconds ago)
Risk Signals: executive_departure, takeover_bid
Recent Events (13 total):
- Carbonite Inc filed 8-K on 2026-03-15. Item 2.05:
  Departure of Directors or Certain Officers
- Carbonite Inc filed 8-K on 2026-03-15. Item 2.01:
  Completion of Acquisition or Disposition of Assets
- Carbonite Inc filed 8-K on 2026-03-15. Item 1.01:
  Entry into a Material Definitive Agreement
Context Freshness: LIVE
That string, formatted, structured, timestamped, and freshness-labeled, is injected directly into the LLM prompt as context. No vector search. No embedding lookup. No stale index. Just the current state of the account, 14 seconds after the last filing.
Compare that to what a batch RAG system injects: the same paragraph from a document that was last embedded at 2 am.
The model is identical in both cases. The context is not.
The Architecture Decision That Made This Possible
I want to address something I’ve been asked several times since Week 1: “Why Pathway? Why not just use Spark Structured Streaming, especially with the new Real-Time Mode (RTM)?”
I have five years of production experience with Kafka and Spark. I know the incumbent stack well enough to know exactly what it would cost us here. Yes, Databricks recently dropped micro-batching with Spark RTM, enabling concurrent processing stages to hit sub-100ms latencies. It’s an incredible engineering feat. But for this specific architecture, Pathway still wins. Let me be direct:
The JVM GC Penalty: Spark RTM still runs on the JVM. The JVM has a garbage collector. Garbage collection introduces unpredictable “stop-the-world” pauses. When your baseline parse time is 0.1ms, and your database write is 1ms, a 200ms GC pause isn’t a footnote—it’s a 100x latency spike that ruins your P99 determinism. Pathway’s engine is written in Rust. No GC. No pauses.
The Stateful Complexity Trap: Building a live knowledge graph requires complex, stateful entity resolution. To minimize latency in Spark RTM, you have to jump through configuration hoops (like forcing Arrow batch sizes to 1, which severely bottlenecks Python UDF performance). Pathway’s incremental dataflow model was built natively to propagate complex delta updates. When a new SEC entry arrives, it processes exactly that entry and its graph relationships immediately, without forcing you to contort your logic to fit a rigid streaming API.
The Operational Overhead: Running Spark RTM requires provisioning a dedicated JVM cluster. You have to disable autoscaling, disable Photon acceleration, and manage executor nodes. Pathway runs as a single Python process backed by a Rust core. One container. No cluster. For a reference architecture designed to be adopted by enterprise teams without a dedicated platform engineering group, that difference is not cosmetic.
To be fair, if your enterprise already runs the latest Databricks runtime and has a team managing high-throughput pipelines (like AdTech attribution), Spark RTM is a massive leap forward.
But for this specific problem, continuous incremental updates to a live knowledge graph with deterministic sub-15ms latency, Pathway’s architecture is the right fit. Spark would require fighting the framework to get the behavior that Pathway gives you by default.
What’s Coming in Week 3
The numbers are real. The graph is alive. Next week, I will build the system that makes the graph trustworthy, the 3-Tier Entity Resolver.
Right now, “iSpecimen Inc.” and “ispecimen” are two different nodes in our graph. “Applied Digital Corp.” and “Applied Digital” could be two different accounts. Every duplicate node is a split relationship, a piece of risk context that never reaches the agent because it’s attached to the wrong entity.
The resolver is where most real-time knowledge graph projects fail. We’re going to solve it in three tiers: deterministic hashing (zero LLM cost, catches 60% of duplicates), graph-contextual neighbor matching (uses the graph’s own relationships to resolve identity), and LLM-as-judge for true ambiguity (batched, structured, minimal cost).
The Ghost Node pattern, how you resolve entities when the graph is too sparse to trust, is the architectural insight at the heart of it.
See you next week.
The repository: github.com/snudurupati/autonomous-knowledge-fabric
All latency numbers are measured from live pipeline runs. OpenTelemetry instrumentation code is in /observability. Reproduce it yourself.
Sreeram Nudurupati | LinkedIn
AI Architect | Building the Autonomous Knowledge Fabric in public: 90 days, no hand-waving.